Table of Contents
A.) History of Naryana Hrudayalaya. 5
- B) Business/products of the company. 6
- C) Management/Board of Directors. 6
- D) Financial Statements. 6
- E) Director’s report 7
- F) Management Discussion and Analysis. 7
- G) Stock market information. 8
- H) Peer/Competitors data. 8
- I) Quarterly results. 9
- J) Balance sheet and the income statement for the current year. 9
Solution 5: Marginal costing. 15
Solution 6: Budgets and Budgetary control 23
- A) The ‘What if’ analysis tool is identified as the managerial term that is basically used in the management and cost accounting. Under this analysis, the managers make necessary changes in the amount and the volume to analyze their impact and effect if these are actually changed in future period of time. This specific analysis technique is also referred to as the sensitivity analysis. For example, what if analysis would be applied when the management plans to increase the sales price of products by $3 per unit and can observe what will happen when prices are actually increased.
- B) The balance score card is identified as the performance metric that is basically used for attainment of strategic management within the organization through four key perspectives, i.e. customers, financial, learning and growth and internal process.
Financial: The perspective shows that how the shareholders can be managed for gaining long term success (Boscia and McAfee, 2014, January). This perspective helps business to solve their financial problems through a focused approach and thus company can improve long term sustainability. An example could be by enhancing profitability and revenue the business would be able to solve its problems.
Customer: The outlook focuses over how the organization would be perceived by the customers for attainment of objective and vision for gaining necessary trust and confidence of customers. An example could be through effective marketing of high quality products for enhancing customers’ satisfaction.
Internal process: The perspective explains what essential business processes are required for gaining excellence in the organization and how these processes can be effectively implied within the organization. An example could be the constant innovation and quality control would help in attaining trust and relevant publicity within the marketing through the different business processes (Grigoroudis, et. al., 2012).
Learning and growth: The outlook shows how the manager would be able to improve and change its current practices and procedures for gaining necessary sustainability within the organization for future success. The example for this could be taken as through establishment of standardized training procedures and quality building among employees.
The budgeting is identified as the process in which budgets are prepared by the organizations that aims at determination of expected expenses and revenue in respect of different activities and operations of the business for a future period (Bogsnes, 2016). Thus, budgeting process mainly emphasizes over preparation of detailed financial statements and results that helps in the future projection of income and expenses for a specific time period in future. A number of budgets are prepared by organizations like Unilever which are as follows:
Master budget: The Unilever Company prepares this budget which is basically a combination of several individual budgets that helps in providing an overall picture regarding the health and financial activities of business. For example, sales budget, production budget, overhead budget etc.
Cash budget: The Unilever organization by preparing this budget aims at future projection of inflow and outflow of cash within the business in a particular time period (Roncalli, 2013). This helps the organization in proper management of cash for distinct activities.
Operating budget: The Unilever Company, with the help of this budget, is able to effectively forecast and analyze the future expenses and losses over the course of operations for a particular time period (Wildavsky, 2017). Thus, the budgets provide accurate prediction regarding, manufacturing expenses, sales, labor, overhead and material cost along with administrative cost etc.
Static budget: This is the fixed budget prepared by Unilever and does not consider changes that occur in the income as well as the sales volume (Cools, et. al., 2017). The budget is mainly used for proper storage and warehousing of products irrespective of change in inventory level due to entering and leaving of inventory from the godown.
Financial budget: This is the budget that is prepared by the Unilever for effective and proper management of future expenses, cash flow, income and assets of the business (Roncalli, 2013). The budget provides a comprehensive picture regarding financial health and the expenditure with respect to key operations of the business.
Sales budget: This budget helps in proper forecasting of total sales for a specific period and is shown in either through quantity or money terms. The budget is important because all other budgets are prepared on the sales budget.
Production budget: The budget helps in forecasting the output that will be produced during a specific period and is helpful in scheduling the production as per the sales budget.
A.) History of Naryana Hrudayalaya
The healthcare institution is identified as the chain of major multispecialty hospitals in India that is founded by Dr. Devi Prasad Shetty in the year 2000. The hospital is currently having its headquarters located at Bengaluru in India with strong presence in states like Karnataka and other southern states of India (Naryana Hrudayalaya, 2018). The hospital was initially started as a hospital with 225 bed capacity and provided services in heart care and other primary facilities. There is also an international hospital at the in the Cayman Islands.
B) Business/products of the company
The hospital provides advanced healthcare services in more than 30 specialties. The major business products can be identified in the form of services in specialties such as Cancer care, Gastroenterology, Cadiac surgery, Neurology, Cardiology, Neurosurgery, Urology, Orthopedics and Nephrology.
C) Management/Board of Directors
|
Position |
Key person |
|
Chairman and CEO |
Dr. Devi Prasad Shetty |
|
Vice Chairman |
Dr. Ashutosh Raguvanshi |
|
Executive Director |
Viren Shetty |
|
Non-Executive Director |
Kiran Mazumdar Shaw |
|
Board of Directors (Independent Director) |
Dinesh Krishna Swamy |
|
|
Muthuraman Balasubramanian |
|
|
Arun Seth |
|
|
B N Subramanya |
|
|
Manohar D Chatlani |
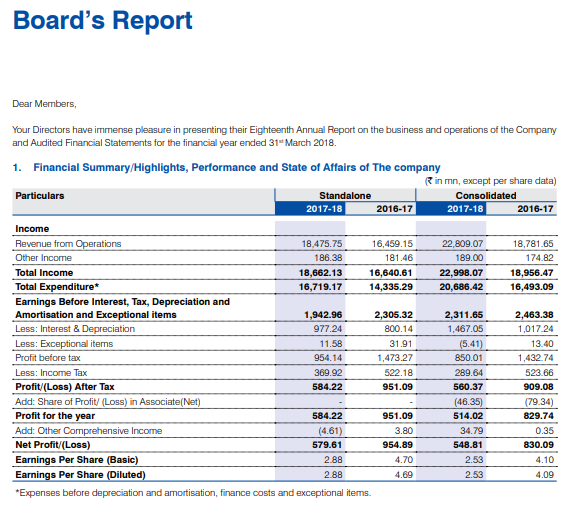
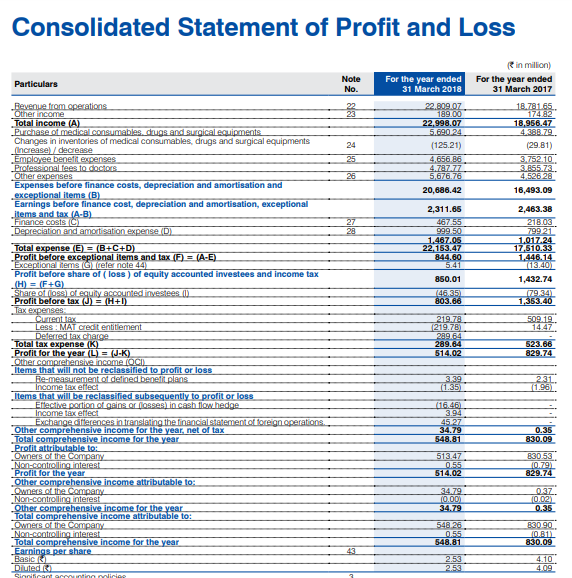
For the year ending 31 March 2018, the revenue from operations for the organization is Rs. 22,809.07 million while it is Rs 18781.65million in the year 2017. The total income has been Rs 22998.07 million for the year 2018 while it is Rs18956.47in the year 2017 (Naryana Hrudayalaya, 2018). The profit for the year is Rs 514.02million while it is Rs 829.74 million in the year 2017. The income tax expenses have reduced to Rs 289.64million in the current year from 523.66in 2017.
The director’s report provides detailed information with respect to the financial and operational performance of the organization. The report enables the shareholders to gain information regarding the related party transactions, non-compliance regarding the capital markets, the whistleblower policy (Naryana Hrudayalaya, 2018). Further, the report also states that the financial statements of the company have materially true and significant and does not hide any material fact that can be misleading. The report also makes sure that the financial statements are prepared in compliance with the relevant accounting standards, laws and regulations.
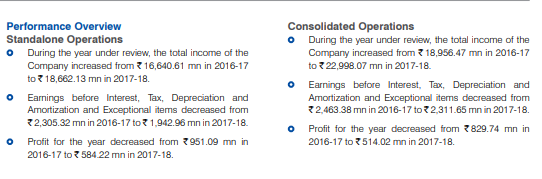
Performance review of consolidated operations
The directors have commented that in the year under review, the total revenue of the organization has raised to Rs 22998.07mn in the year 2017-18 from Rs 18956.47mn in 2016-17. The earnings before interest, tax, amortization and depreciation and the exceptional items has reduced to Rs 2311.65mn in 2017-18 from Rs 2463.38mn in 2016-17.
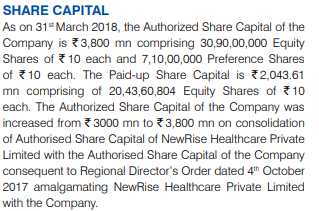
Along with the authorized share capital of the company as on 31 March 2018 is Rs 3800mn that is made up of 71000000 preferences shares of Rs 10 each and 309000000 equity shares of Rs 10 each. The directors have also commented that a suitable risk management policy has been formulated with the help of Audi, risk and compliance committee. The directors have also proposed for the insider trading policy.

F) Management Discussion and Analysis
The organization aims for maintaining the superior quality standard for clinical excellence, satisfaction and the patient health care. With respect to the governance and accountability, the organization aims for developing an environment that is responsible and transparent so that the highest corporate standards and trust can be achieved with the customers. The organization has also adopted an appropriate Dividend Declaration Policy so that proper dividend can be provided to employees.
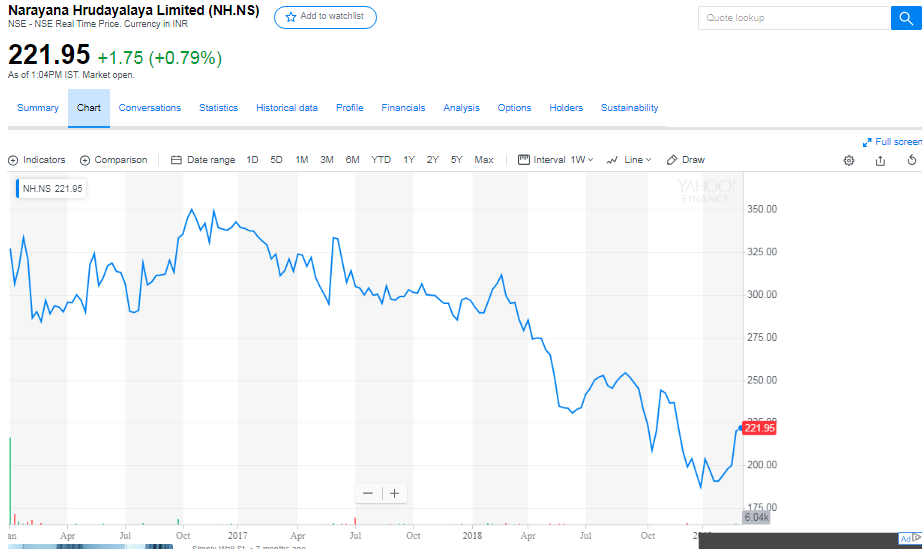
(Source: Yahoo finance, 2018)
The above chart show the five year comparative stock chart of Naryana Hrudayalaya and it can be observed that there is continuously decline over a period of five years in the stock prices of the company. Thus, the organization is required to adopt necessary policies for maintaining its stock prices.
The major competitors of the organization have been identified as Apollo Hospitals, Manipal Hospitals and the Fortis healthcare. The Apollo hospitals are earning revenue of $1.1billion while the Manipal Hospitals are earning revenue of $196million. In case of Fortis, it generates revenue of $628.2million as compared to other major hospital chains of India.
The third quarter results of the company showed the total operating revenue as INR 7321 million while the total expenses were INR 6542 million. The profit after tax for the current quarter was INR 127 million (Naryana Hrudayalaya, 2018). In case of balance sheet, the long term debt showed INR 8174 million in the long term debt for the third quarter while it is INR 51 million for short term debt. The shareholder equity is INR 10568 million in the current quarter.
J) Balance sheet and the income statement for the current year
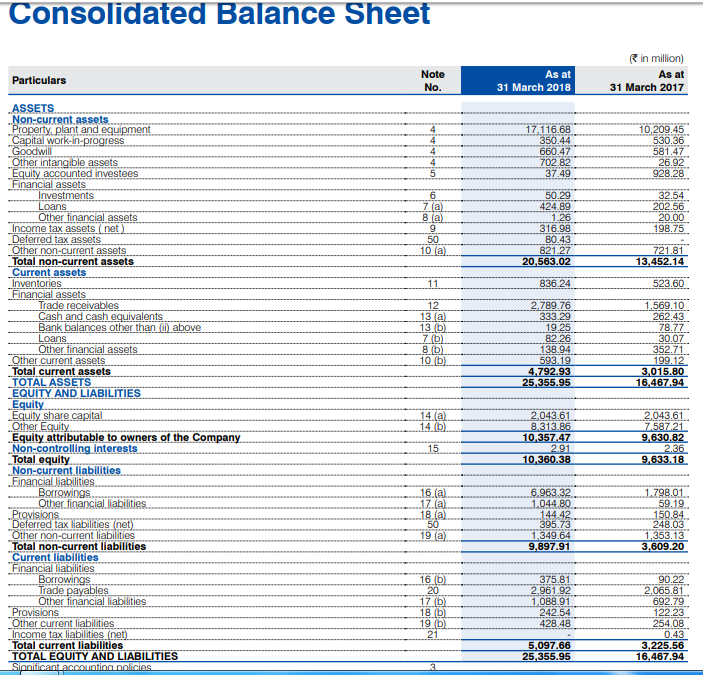
In the current year, the current assets of the company have increased to Rs 4792 million in 2018 and the non-current assets have increased to 20563.02 million. The total assets have increased to Rs 25355.95 million in the current year. The current liabilities of the company have increased to 5097.66 million in the current period and the noncurrent liabilities have increased to Rs 9897.91million in the present period (Naryana Hrudayalaya, 2018). In case of income statement, the profit before tax has reduced to Rs 803.66 in the current period. This may be due to increase in the expenses which have raised to Rs 22153.47 million in the current year.
Comment: As per the management views and analysis, the detailed discussion has been made regarding the financial and the operating performance of the organization and the organizations has taken relevant steps for improving the current condition of the company through the distinct function areas. Thus, it is recommended that the new investor can invest in the company for gaining relevant profits and further, in case of the existing investors the organization is making constant improvements in the operations which enhance the long term profitability of the company.
Solution 4: Ratio analysis
|
Problem 1 |
Company A |
Company B |
|
Current assets |
500 |
800 |
|
Current liabilities |
200 |
300 |
|
Current ratio = current assets/Current liabilities |
2.5 |
2.67 |
|
|
|
|
|
profit after tax |
800 |
720 |
|
Reserves & Surplus |
2200 |
1900 |
|
Equity share capital |
500 |
400 |
|
Shareholder's equity |
2700 |
2300 |
|
Return on equity= Net income/Shareholder's equity |
0.30 |
0.31 |
|
|
|
|
|
|
|
|
|
Net Sales |
4500 |
4400 |
|
Fixed Assets |
900 |
1000 |
|
Turnover to fixed asset= Net sales /fixed asset |
5 |
4.4 |
|
|
|
|
|
Current liabilities |
200 |
300 |
|
Non current liabilities (Term loan) |
200 |
500 |
|
Shareholders' fund |
2700 |
2300 |
|
Debt equity ratio= Total debt/Shareholders' equity |
0.07 |
0.22 |
|
|
|
|
|
Profit after tax |
800 |
720 |
|
No. of Equity shares |
500 |
400 |
|
EPS= Profit after tax/Total number of equity shares |
1.6 |
1.8 |
|
|
|
|
|
Dividend per share |
1 |
1.1 |
|
Earnings per share |
1.6 |
1.8 |
|
Dividend payout ratio= DPS/EPS *100 |
62.5 |
61.1 |
|
|
|
|
|
Equity |
500 |
400 |
|
Reserves and surplus |
2200 |
1900 |
|
Profit after tax |
800 |
720 |
|
Book value per share |
3.8 |
3.95 |
|
Market price share |
15 |
16.5 |
|
price to book value |
3.95 |
4.18 |
|
|
|
|
|
Market price per share |
15 |
16.5 |
|
Earnings per share |
1.6 |
1.8 |
|
Price to earnings ratio= MPS/EPS |
9.38 |
9.17 |
|
Problem 2 |
|
|
Current assets |
30 |
|
Current liabilities |
10 |
|
Current ratio |
3 |
|
|
|
|
Total debts |
50 |
|
Shareholder's equity |
170 |
|
Debt equity ratio |
0.29 |
|
|
|
|
Net Sales |
630 |
|
Fixed Assets |
90 |
|
Turnover to fixed assets |
7 |
|
|
|
|
Profit after tax |
60 |
|
Shareholders' equity |
170 |
|
Return on equity |
35% |
|
|
|
|
Total assets |
220 |
|
Current liabilities |
10 |
|
Capital employed |
210 |
|
profit before tax |
90 |
|
Return on capital employed= Profit before tax/capital employed |
43% |
|
|
|
|
Profit after tax |
60 |
|
Number of equity shares |
10 |
|
EPS |
6 |
|
|
|
|
Operating profit |
60 |
|
Net Sales |
630 |
|
Operating profit ratio |
10% |
|
|
|
|
MPS |
7.2 |
|
EPS |
6 |
|
price to earnings ratio |
1.2 |
|
Problem 3 |
|
|
|
Net Sales |
3600000 |
|
|
Total assets |
1200000 |
|
|
Fixed assets |
720000 |
|
|
Current assets |
480000 |
|
|
Inventory |
180000 |
|
|
Debtors |
240000 |
|
|
Current liabilities |
240000 |
|
|
Net Worth |
480000 |
|
|
Long term debt (loans) |
480000 |
|
|
Cash |
60000 |
|
|
Balance sheet |
|||
|
Liabilities |
Amount |
Assets |
Amount |
|
Net Worth |
480000 |
Fixed assets |
720000 |
|
Long term loans |
480000 |
Stock |
180000 |
|
Current liabilities |
240000 |
Debtors |
240000 |
|
|
|
Cash |
60000 |
|
Total |
1200000 |
Total |
1200000 |
|
Problem 4 |
|
|
|
|
Profit and loss account |
|||
|
For the year ended 2016-17 |
|||
|
Particulars |
Amount |
Particulars |
Amount |
|
Cost of Sales |
37057 |
Net revenue |
59289 |
|
Gross profit c/d |
22232 |
|
|
|
|
|
|
|
|
Selling and marketing expenses |
2728 |
By Gross profit b/d |
22232 |
|
General and Adm. exp. |
3628 |
|
|
|
Total operating expenses |
6356 |
|
|
|
Operating profit |
15876 |
|
|
|
|
|
|
|
|
|
|
By Operating profit |
15876 |
|
|
|
Other income |
3062 |
|
|
|
|
|
|
Net profit before tax |
18938 |
By Net profit before tax |
18938 |
|
Tax expenses |
5120 |
|
|
|
|
|
|
|
|
Net profit after tax |
13818 |
|
|
|
|
|
|
|
|
Question 6: |
||||||
|
Operational performance ratio |
||||||
|
Operating performance ratio: Net sales / net property plants and the equipment |
||||||
|
Operating performance ratio: |
||||||
|
|
17-18 |
16-17 |
||||
|
net sales |
2019.75 |
1649.05 |
||||
|
Net property plants and the equipment |
1360.08 |
1399.37 |
||||
|
Operating performance ratio |
1.49 |
1.18 |
||||
|
performance ratio of the company is improving as compared to that of the last year. |
|
|
||||
|
Liquidity and the profitability ratio: |
||
|
Current ratio: Current assets / Current liablities |
||
|
|
2018 |
2017 |
|
Current assets |
596.27 |
508.63 |
|
Current liablities |
2757.12 |
2271.42 |
|
current ratio- |
0.22 |
0.22 |
|
Quick ratio: Liquid assets/ Current liabilities |
||
|
|
2018 |
2017 |
|
Current assets |
596.27 |
508.63 |
|
Inventories |
299.91 |
296.62 |
|
Liquid assets |
296.36 |
212.01 |
|
Current liabilities |
2757.12 |
2271.42 |
|
Quick ratio |
0.11 |
0.09 |
Liquidity position of the company is same as compared to that of the last year, but company need to make the improvement in the generating the liquid assets in the company.
|
Profitability ratios: |
||
|
Gross margin ratio: gross profits/ net sales*100 |
||
|
|
2018 |
2017 |
|
Gross profit |
719.71 |
564.56 |
|
net sales |
2019.75 |
1649.05 |
|
gross profit ratio |
35.63 |
34.24 |
|
|
|
|
|
Operating margin ratio: operating profit / net sales*100 |
||
|
|
2018 |
2017 |
|
operating profits |
214.4 |
-145.24 |
|
net sales |
2019.75 |
1649.05 |
|
operating profit ratio |
0.11 |
-0.09 |
|
|
|
|
|
Performance of the company is improving as compared to that of the last year. |
|
|
|
Captital structure ratio: |
||
|
|
|
|
|
Debt to equity ratio: Debt / Equity |
||
|
|
2018 |
2017 |
|
Debt |
412.53 |
990.43 |
|
Equity |
1800.56 |
1615.43 |
|
debt equity ratio |
0.23 |
0.61 |
|
|
|
|
|
|
|
|
|
Asset coverage ratio: (Total asset - Intangible assets) - (Current liablities - short term debts)/Total debts |
||
|
|
2018 |
2017 |
|
Total assets |
4970.21 |
4877.28 |
|
Intangible asset |
0 |
0 |
|
Net assets |
4970.21 |
4877.28 |
|
Current liablities |
2757.12 |
2271.42 |
|
Short term debts |
1682.75 |
1437.41 |
|
Current liablities - Short term debts |
1074.37 |
834.01 |
|
Total debts |
3169.65 |
3261.85 |
|
Asset coverage ratio |
1.23 |
1.24 |
|
|
|
|
|
Performance of the company is improving in terms of the capital structure, the company is operating on the own funds but is generating the less revenue from the assets employed in the company as compared to that of the last year. |
|
|
|
Problem 1 |
|
|
Fixed Cost |
250000 |
|
Variable cost |
750000 |
|
sales |
1125000 |
|
Output (units) |
75000 |
|
|
|
|
Contribution |
375000 |
|
Profit earned during the year |
125000 |
|
Problem 2 |
|
|
Sales |
100000 |
|
Variable cost |
70000 |
|
Contribution |
30000 |
|
P/V ratio |
30% |
|
Profit |
10000 |
|
Fixed cost |
20000 |
|
Sales Volume to earn a profit of 40000 |
2 |
|
Problem 3 |
|
|
Direct material |
5 |
|
Direct labor |
2 |
|
Direct overhead |
2 |
|
Variable cost per unit |
9 |
|
Fixed cost |
90000 |
|
Selling price per unit |
12 |
|
Contribution per unit |
3 |
|
P/V ratio |
25% |
|
Break Even Sales (in units) |
30000 |
|
Break Even Sales (in RO) |
360000 |
|
Sales for earning a profit of 450000 |
2160000 |
|
Problem 4 |
|
|
Change in Profits |
200000 |
|
Change in Sales |
1000000 |
|
P/V ratio |
20% |
|
Fixed Cost for the period 1 |
200000 |
|
Sales required to earn profit of 500000 |
3500000 |
|
Profit when sales are 1000000 |
500000 |
|
Problem 5 |
|
|
Change in profits |
8000 |
|
Change in sales |
20000 |
|
P/V ratio |
40% |
|
Fixed cost for the period 1 |
25000 |
|
BEP |
62500 |
|
Profit for estimated sales of 125000 |
25000 |
|
Sales for earning a profit of20000 |
112500 |
|
Problem 6: |
|
|
Sales |
2000000 |
|
Variable cost |
1200000 |
|
Contribution |
800000 |
|
Contribution per unit |
8 |
|
fixed cost |
400000 |
|
BEP in units |
50000 |
|
Problem 7 |
|
|
Change in profits |
4000 |
|
Change in sales |
20000 |
|
a.) PV ratio |
20% |
|
sales in 2015 |
220000 |
|
Fixed cost |
30000 |
|
b.) Break even point |
150000 |
|
|
|
|
desired Profit |
18000 |
|
Fixed cost |
30000 |
|
contribution |
48000 |
|
PV ratio |
20% |
|
c.) sales in RO |
168000 |
|
Problem 8: |
|
||||||||||||||||||||||||||||||||||||||||||||||||||||||||||||||||||||||||||||||||||||
|
Particulars |
|
current capacity 70% |
offer units |
|
|||||||||||||||||||||||||||||||||||||||||||||||||||||||||||||||||||||||||||||||||
|
Total capacity |
|
19000 |
5000 |
|
|||||||||||||||||||||||||||||||||||||||||||||||||||||||||||||||||||||||||||||||||
|
Utilization capacity |
|
13300 |
|
|
|||||||||||||||||||||||||||||||||||||||||||||||||||||||||||||||||||||||||||||||||
|
Ideal capacity |
|
5700 |
|
|
|||||||||||||||||||||||||||||||||||||||||||||||||||||||||||||||||||||||||||||||||
|
Sales price per unit |
21 |
21 |
15 |
|
|||||||||||||||||||||||||||||||||||||||||||||||||||||||||||||||||||||||||||||||||
|
Sales in value |
|
279300 |
75000 |
|
|||||||||||||||||||||||||||||||||||||||||||||||||||||||||||||||||||||||||||||||||
|
Less variable cost |
11.8 |
156940 |
59000 |
|
|||||||||||||||||||||||||||||||||||||||||||||||||||||||||||||||||||||||||||||||||
|
contribution |
9.2 |
122360 |
16000 |
|
|||||||||||||||||||||||||||||||||||||||||||||||||||||||||||||||||||||||||||||||||
|
less: Fixed cost |
|
79800 |
0 |
|
|||||||||||||||||||||||||||||||||||||||||||||||||||||||||||||||||||||||||||||||||
|
Profits |
|
42560 |
16000 |
|
|||||||||||||||||||||||||||||||||||||||||||||||||||||||||||||||||||||||||||||||||
|
a) Offer of 1000 units should be accepted instead of 5000 units |
|||||||||||||||||||||||||||||||||||||||||||||||||||||||||||||||||||||||||||||||||||||
|
b) For making the production of the 10000 units company have to make the sacrifice of the 4300 units from the current production units and have to sacrifice the contribution of RO 9.2 per unit for earning the contribution of RO 3.2 per unit. And the company will also incurred the additional fixed cost for making the production of the 10000 units as this production of 10000 units exceeds the idle production capacity of the company which is 5700 units @ 6=25800 |
|
||||||||||||||||||||||||||||||||||||||||||||||||||||||||||||||||||||||||||||||||||||
|
|
|||||||||||||||||||||||||||||||||||||||||||||||||||||||||||||||||||||||||||||||||||||
|
c) Company should accept the proposal to buy the 5000 units @15 from the local buyer because in this case also the company will not be incurring any of the additional fixed cost and the contribution earned by the company is the profit earned by the company. |
|
||||||||||||||||||||||||||||||||||||||||||||||||||||||||||||||||||||||||||||||||||||
|
d)If the buyer of the products of the company is government then the minimum cost that can be quoted to the government will be equal to that of the variable cost of production of the company.
|
|
||||||||||||||||||||||||||||||||||||||||||||||||||||||||||||||||||||||||||||||||||||
|
Alternative B: |
||
|
Particulars |
B |
|
|
Units |
800 |
|
|
Sales price |
40 |
|
|
Sales value |
32000 |
|
|
less: Direct material |
9600 |
|
|
Less: direct wages |
6400 |
|
|
less: Variable overhead |
9600 |
|
|
total variable cost |
25600 |
|
|
Contribution |
6400 |
|
|
fixed cost |
1500 |
|
|
profits |
4900 |
|
|
Alternative c: |
||
|
Particulars |
A |
B |
|
Units |
800 |
200 |
|
Selling price |
50 |
40 |
|
Sales value |
40000 |
8000 |
|
Direct cost |
12800 |
2400 |
|
Direct wages |
9600 |
1600 |
|
Variable overhead |
14400 |
2400 |
|
Total variable cost |
36800 |
6400 |
|
Contribution |
3200 |
1600 |
|
Fixed overhead |
1500 |
1500 |
|
Profits |
1700 |
100 |
|
Total profits |
1800 |
|
|
Alternative D |
|
||
|
Particulars |
A |
B |
|
|
Units |
300 |
700 |
|
|
selling price |
50 |
40 |
|
|
Sales value |
15000 |
28000 |
|
|
Direct cost |
4800 |
8400 |
|
|
Direct wages |
3600 |
5600 |
|
|
Variable overhead |
5400 |
8400 |
|
|
total variable cost |
13800 |
22400 |
|
|
Contribution |
1200 |
5600 |
|
|
Fixed overhead |
1500 |
1500 |
|
|
Profits |
-300 |
4100 |
|
|
Total profit |
3800 |
|
|
|
|
|
|
|
|
Decision |
Alternative B should be selected |
|
|
|
Problem 10: |
|
|
|
|
|
|
|
Present performance |
Selling price redued by 10% |
Selling price to be reduced by 20% |
|
|
|
Unit |
100000 |
111111 |
|
|
|
|
selling price |
200 |
180 |
160 |
|
|
|
sales value |
20000000 |
20000000 |
|
|
|
|
cost: |
|
|
|
|
|
|
Material |
60 |
60 |
60 |
|
|
|
wages |
20 |
20 |
20 |
|
|
|
variable overhead |
20 |
20 |
20 |
|
|
|
total cost |
100 |
100 |
100 |
|
|
|
contribution |
100 |
80 |
60 |
|
|
|
Fixed cost |
50 |
|
|
|
|
|
Profits |
50 |
|
|
|
|
|
|
|
|
|
|
|
|
|
If the selling price is to be reduced by 10% |
If selling price to be reduced by 20% |
|
|
|
|
sales in value |
|
|
|
|
|
|
Fixed cost |
5000000 |
5000000 |
|
|
|
|
Desired profit |
5000000 |
5000000 |
|
|
|
|
Existing sales price |
200 |
200 |
|
|
|
|
Contribution per unit: |
|
|
|
|
|
|
selling price |
180 |
160 |
|
|
|
|
less: total variable cost |
100 |
100 |
|
|
|
|
Contribution per unit |
80 |
60 |
|
|
|
|
Sales in units |
125000 |
166666.67 |
|
|
|
|
Problem 11: |
|
|
|
|
Part A. |
|
|
|
|
Calculation of the break even point in units and the value |
|
|
|
|
Total fixed cost |
36000 |
|
|
|
selling price |
3 |
|
|
|
total vatiable cost |
2.1 |
|
|
|
Contribution per unit |
0.9 |
|
|
|
Break even point in units |
fixed cost / contribution per unit |
|
|
|
BEP (Units) |
40000 |
|
|
|
|
|
|
|
|
PV Ratio |
0.3 |
|
|
|
BEP In value |
120000 |
|
|
|
|
|
|
|
|
Units sold |
35000 |
|
|
|
Selling price |
3 |
|
|
|
sales value |
105000 |
|
|
|
Less: Variable cost |
73500 |
|
|
|
Contribution |
31500 |
|
|
|
Less: Fixed cost |
36000 |
|
|
|
Loss |
-4500 |
|
|
|
|
|
|
|
|
Part b: |
|
|
|
|
selling price |
3 |
|
|
|
variable cost |
1.95 |
|
|
|
Contribution per unit |
1.05 |
|
|
|
Fixed cost |
27000 |
|
|
|
Break even points in unit |
25714 |
|
|
|
|
|
|
|
|
Problem 12 |
|
|
|
|
particulars |
present performance |
proposal 10000 units |
|
|
present operating capacity |
50% |
|
|
|
idle capacity |
50% |
|
|
|
sales |
40000 |
10000 |
|
|
sales in value |
560000 |
130000 |
|
|
selling price per unit |
14 |
13 |
|
|
less; Direct material |
160000 |
40000 |
|
|
Direct labor |
80000 |
20000 |
|
|
Variable overhead |
240000 |
60000 |
|
|
total variable cost |
480000 |
120000 |
|
|
Contribution |
80000 |
10000 |
|
|
less fixed cost |
160000 |
0 |
|
|
Loss |
-80000 |
10000 |
|
|
Decision: Company should accept the offer because if the company accepts the offer then the total loss of the company will get reduced by the profit of RO 10000 incurred on acceptance of offer. |
Solution 6: Budgets and Budgetary control
|
Problem 1: |
|||||
|
Particular |
August |
September |
October |
November |
December |
|
Sales |
50000 |
52000 |
66000 |
60000 |
70000 |
|
Material |
32400 |
30000 |
36000 |
30000 |
38000 |
|
wages |
7600 |
7600 |
8000 |
8400 |
9000 |
|
Overheads |
3800 |
4200 |
4600 |
4800 |
5000 |
|
Cash Budget |
|||||
|
Particular |
August |
September |
October |
November |
December |
|
Opening balance |
|
|
8000 |
16800 |
34200 |
|
collection from the debtor |
|
50000 |
52000 |
66000 |
60000 |
|
total receivable |
|
|
60000 |
82800 |
94200 |
|
payment: |
|
|
|
|
|
|
Advance tax |
|
5000 |
|
|
5000 |
|
Payment to creditor 10% |
3240 |
3000 |
3600 |
3000 |
3800 |
|
Payment to creditor 90% |
|
29160 |
27000 |
32400 |
27000 |
|
wages |
7600 |
7600 |
8000 |
8400 |
9000 |
|
overheads |
3800 |
4200 |
4600 |
4800 |
5000 |
|
Total payment |
|
|
43200 |
48600 |
44800 |
|
Closing balance |
|
|
16800 |
34200 |
49400 |
|
Problem 2: |
|||||
|
Particular |
August |
September |
October |
November |
December |
|
Sales |
140000 |
172000 |
176000 |
150000 |
160000 |
|
Material |
120000 |
120000 |
119600 |
120000 |
121000 |
|
wages |
17600 |
17600 |
18000 |
18400 |
19000 |
|
Overheads |
13800 |
14200 |
14600 |
14800 |
15000 |
|
Cash Budget |
|||||
|
Particular |
August |
September |
October |
November |
December |
|
Opening balance |
|
58000 |
12000 |
34240 |
20000 |
|
Collection fron debtor 50% |
70000 |
86000 |
88000 |
75000 |
80000 |
|
Collection fron debtor 50% |
|
70000 |
86000 |
88000 |
75000 |
|
Total receipt |
70000 |
214000 |
186000 |
197240 |
175000 |
|
payments: |
|
|
|
|
|
|
Advance tax |
|
15000 |
|
|
15000 |
|
Payment to creditors 10% |
12000 |
12000 |
11960 |
12000 |
12100 |
|
Payment to creditor 90% |
|
108000 |
108000 |
107640 |
108000 |
|
wages |
|
17600 |
17600 |
18000 |
18400 |
|
Overheads |
|
13800 |
14200 |
14600 |
14800 |
|
Purchase of the machinery |
|
|
|
25000 |
25000 |
|
Total payment |
12000 |
166400 |
151760 |
177240 |
193300 |
|
Closing balance |
58000 |
47600 |
34240 |
20000 |
-18300 |
|
Problem 3: |
||||
|
particulars |
June |
july |
august |
september |
|
cash sales |
120000 |
140000 |
152000 |
121000 |
|
Credit sales |
100000 |
80000 |
140000 |
120000 |
|
Purchase |
160000 |
170000 |
240000 |
180000 |
|
Other expenses |
18000 |
20000 |
22000 |
21000 |
|
Wages |
21000 |
22000 |
23000 |
24000 |
|
Cash budget |
||||
|
Particulars |
June |
July |
August |
September |
|
opening cah balance |
|
22000 |
37000 |
53500 |
|
receipts: |
|
|
|
|
|
Cash sales |
120000 |
140000 |
152000 |
121000 |
|
50% of the credit sales |
45000 |
36000 |
63000 |
54000 |
|
50% of the credit sales |
|
47500 |
38000 |
66500 |
|
Total receipt |
165000 |
245500 |
290000 |
295000 |
|
Payments: |
|
|
|
|
|
Purchase 25% |
40000 |
42500 |
60000 |
45000 |
|
purchase 75% |
|
120000 |
127500 |
180000 |
|
Wages |
|
21000 |
22000 |
23000 |
|
Other expenses |
18000 |
20000 |
22000 |
21000 |
|
Interest payable |
5000 |
5000 |
5000 |
5000 |
|
Total payment |
63000 |
208500 |
236500 |
274000 |
|
Closing balance |
102000 |
37000 |
53500 |
21000 |
|
Problem 4: |
|||||
|
Particulars |
February |
March |
April |
May |
June |
|
sales |
60000 |
62000 |
64000 |
58000 |
56000 |
|
Material |
36000 |
38000 |
33000 |
35000 |
39000 |
|
Wages |
9000 |
8000 |
10000 |
8500 |
9500 |
|
Overheads |
4000 |
4200 |
4600 |
4800 |
4000 |
|
Cash Budgets |
|||||
|
Particulars |
February |
March |
April |
May |
June |
|
Opening balance |
|
|
5000 |
20500 |
39150 |
|
Receipt: |
|
|
|
|
|
|
cash sales |
6000 |
6200 |
6400 |
5800 |
5600 |
|
50% of the credit sales |
27000 |
27900 |
28800 |
26100 |
25200 |
|
50% of the credit sales |
|
27000 |
27900 |
28800 |
26100 |
|
Total receipts |
33000 |
61100 |
68100 |
81200 |
96050 |
|
Payments: |
|
|
|
|
|
|
Payment to creditor |
|
36000 |
38000 |
33000 |
35000 |
|
Advance tax |
|
|
|
|
8000 |
|
Overheads |
4000 |
4200 |
4600 |
4800 |
4000 |
|
Wages |
4500 |
4000 |
5000 |
4250 |
4750 |
|
Total payment |
8500 |
|
47600 |
42050 |
51750 |
|
Closing balance |
|
|
20500 |
39150 |
44300 |
References
Bogsnes, B., 2016. Implementing beyond budgeting: Unlocking the performance potential. John Wiley & Sons.
Boscia, M.W. and McAfee, R.B., 2014, January. Using the balance scorecard approach: A group exercise. In Developments in Business Simulation and Experiential Learning: Proceedings of the Annual ABSEL conference (Vol. 35).
Cools, M., Stouthuysen, K. and Van den Abbeele, A., 2017. Management control for stimulating different types of creativity: The role of budgets. Journal of Management Accounting Research, 29(3), pp.1-21.
Grigoroudis, E., Orfanoudaki, E. and Zopounidis, C., 2012. Strategic performance measurement in a healthcare organisation: A multiple criteria approach based on balanced scorecard. Omega, 40(1), pp.104-119.
Naryana Hrudayalaya, 2018.Annual report. [Online] https://www.narayanahealth.org/sites/default/files/download/annual-reports/NHL_Annual_Report_2017-18.pdf [Accessed 5 March 2019].
Roncalli, T., 2013. Introduction to risk parity and budgeting. CRC Press.
Wildavsky, A., 2017. Budgeting and governing. Routledge.
Winston, W., 2016. Microsoft Excel data analysis and business modeling. Microsoft press.
Yahoo Finance, 2018. Stock Chart. [Online] [Accessed 5 March 2019].