Table of Contents
Alternate investment appraisal method. 20
Table 1: Average Full Time Employee. 14
Table 2: Total sales area (000s square feet) 15
Table 3: Income statement of JBZ. 18
Table 4: Cash flow statement of JBZ. 19
Table 5: Capital allowances computation. 20
Answer 1
Part A
Current ratio
Figure 1: Current ratio anal
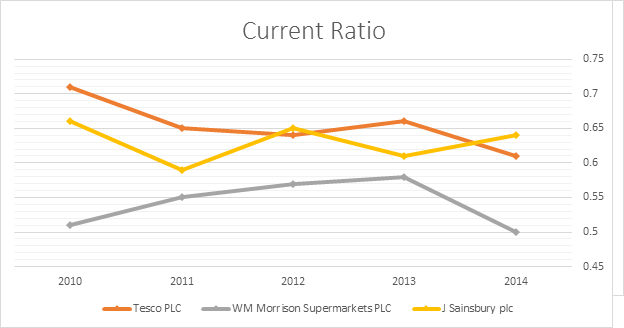
Current ratio of J Sainsbury Plc has been in narrow range in last five years while current ratio of Tesco Plc declined over the years and current ratio of WM Morrison has been at quite lower level. Usually, current ratio of one or higher than it is desirable. Current ratio of WM Morrison has been as low as 0.5 and remained lower than other two competitors for all five years. Current ratio of J Sainsbury has been relatively very stable compared to other two firms.
Individual performance:
Best performing: J Sainsbury Plc, Worst performing: WM Morrison Supermarkets Plc
Overall:
Best performing: Tesco Plc, Worst performing: WM Morrison Supermarkets Plc
Quick Ratio:
Figure 2: Quick ratio analysis
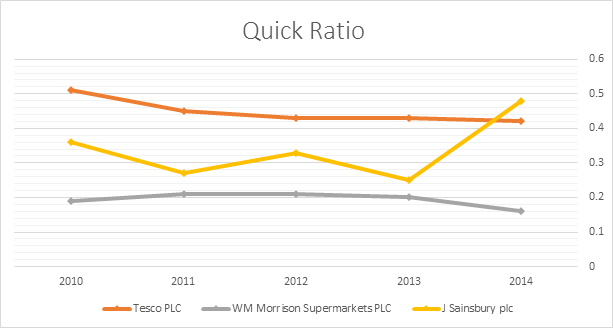
Quick ratio is considered more liquid than current ratio as it doesn’t consider inventory as liquid assets (GÂDOIU, 2014). While quick ratio of Tesco Plc declined for first two years and remained stable for last three years, the ratio of J Sainsbury improved drastically in last year. Quick ratio of J Sainsbury has been in range of 0.25 to 0.36 between 2010 to 2013 and improved to 0.48 in 2014. Quick ratio of WM Morrison has been at very low level and was in range of 0.16 to 0.21 in last five years.
Individual performance:
Best performing: J Sainsbury Plc, Worst performing: WM Morrison Supermarkets Plc
Overall:
Best performing: Tesco Plc, Worst performing: WM Morrison Supermarkets Plc
Long Term debt/Equity
Figure 3: Long Term debt/equity analysis
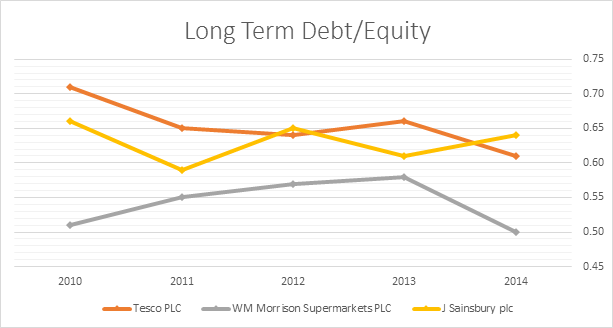
Long term debt to equity belongs to long term solvency ratio. It helps to identify the financing structure of business. As it shows relative financing of long term debt and equity, the ratio higher than one shows debt funding is higher than equity and ratio lower than one indicates equity funding is higher than debt. For all three companies, portion of equity funding is higher. As investors prefer stability of business, stable financial structure is preferred over volatile structure. For every $1 in equity, debt funding is $0.61, $0.64 and $0.50 for Tesco, Morrison and J Sainsbury respectively in 2014 compared to $0.71, 0.66 and $0.51 in 2010. end reversal identified for Morrison in 2014.
Individual performance:
Best performing: J Sainsbury Plc, Worst performing: WM Morrison Supermarkets Plc
Overall:
Best performing: J Sainsbury Plc, Worst performing: WM Morrison Supermarkets Plc
Total debt/Total Capital
Figure 4: Total debt/Total capital analysis
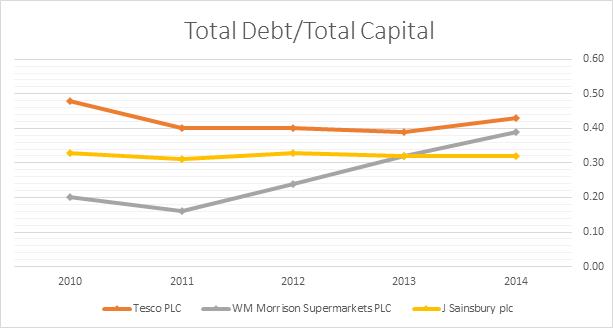
Total debt to total capital ratio shows proportion of debt funding used to finance the resources of the firm. As higher debt ratio increases default risk it’s not recommended that companies have higher debt ratio or increasing debt level. Moreover, as it belongs to financial structure ratios, it’s desirable that the ratio remains stable. Debt ratio of Morrison is increasing since 2011 year on year which is somewhere negative indicator (GÂDOIU, 2014). Debt ratio of Tesco and J Sainsbury is stable over the years but debt ratio of J Sainsbury has been more stable.
Debt ratio of WM Morrison Supermarkets Plc increased from 0.16 to 0.39 between 2011 to 2014.
Individual performance:
Best performing: Tesco Plc, Worst performing: WM Morrison Supermarkets Plc
Overall:
Best performing: J Sainsbury Plc, Worst performing: Tesco Plc
Asset Turnover
Figure 5: Total asset turnover analysis
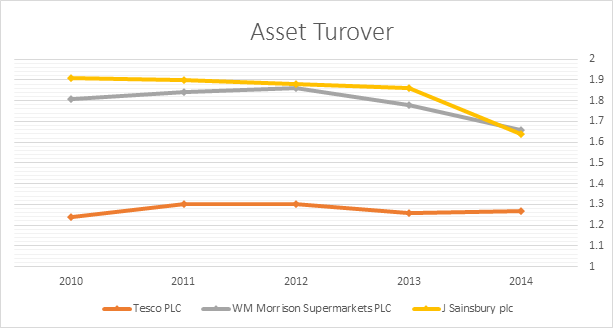
Asset turnover ratio shows sales generated over the total assets. Higher ratio shows the firm is able to generate more sales with available assets. Though asset turnover ratio is increasing for Tesco Plc but the ratio is already at lower level than other two companies. While Asset turnover improved by 2.42% for Tesco and declined by 8.29% and 14.14% for Morrison and J Sainsbury respectively. Still, historical performance of J Sainsbury is more reliable than other two players.
Individual performance:
Best performing: Tesco Plc, Worst performing: J Sainsbury
Overall:
Best performing: J Sainsbury, Worst performing: Tesco Plc
Inventory Turnover
Figure 6: Inventory turnover analysis
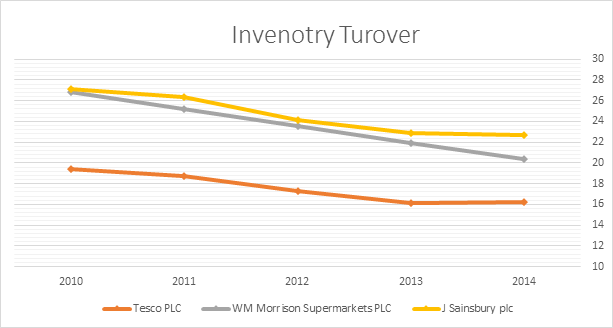
The trend of inventory turnover ratio is declining for all three companies. Similar to asset turnover ratio, Tesco Plc has lowest inventory turnover ratio which makes firm to hold more inventory to generate $1 revenue compared to other firms. Trend of inventory turnover ratio of J Sainsbury and WM Morrison is similar but J Sainsbury performed relatively better than WM Morrison. Inventory turnover ratio declined by 16.57% and 24.08% for J Sainsbury and WM Morrison respectively.
Individual performance:
Best performing: Tesco Plc, Worst performing: WM Morrison Supermarket Plc
Overall:
Best performing: J Sainsbury, Worst performing: Tesco Plc
Gross Margin
Figure 7: Gross margin analysis
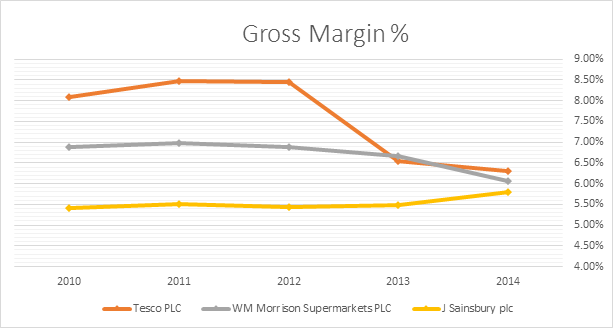
Trend of Gross margin is declining for Tesco Plc and WM Morrison Supermarket Plc. Though gross margin of J Sainsbury is lower than other two companies, the company looks more promising than other two because gross margin is improving for J Sainsbury while declining for other two companies. Also, difference between gross margin was significant in 2010 and by 2014 difference is marginal only. While gross margin of Tesco declined by -1.8%, the gross margin of J Sainsbury improved by 0.4% between 2010 to 2014. The gross margin of Morrison declined by -0.8% during same period. Trend suggest in next two periods gross margin of J Sainsbury would be higher than other two firms.
Individual performance:
Best performing: J Sainsbury, Worst performing: Tesco Plc
Overall:
Best performing: J Sainsbury, Worst performing: WM Morrison Supermarket Plc
Operating Margin
Figure 8: Operating margin analysis
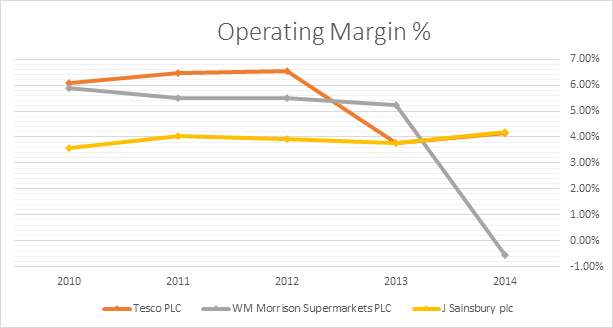
The trend of operating margin makes picture of profitability more clear. While operating and gross margin of Tesco Plc and WM Morrison is declining year on year and rapidly, Operating margin of J Sainsbury improved year on year and it’s more stable than other firms. In 2010, operating margin of J Sainsbury was 3.56% which was lower than other two firms (5.89% and 6.07%) and by the end of 2014 J Sainsbury had operating margin of 4.21% which was higher than other two firms (-0.54%, 4.14%). WM Morrison suffered most on operating margin as profitability declined from 5.89% to -0.54% in five years.
Individual performance:
Best performing: J Sainsbury, Worst performing: WM Morrison Supermarket Plc
Overall:
Best performing: J Sainsbury, Worst performing: WM Morrison Supermarket Plc
Return in assets
Figure 9: Return on assets analysis
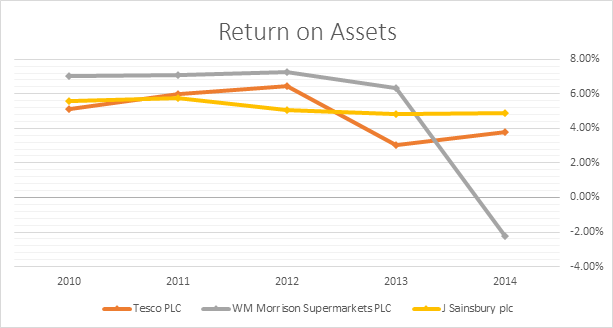
WM Morrison generated more return on assets in 2010, 2011, 2012 and 2013 than Tesco Plc and J Sainsbury Plc. But there is trend reversal in 2014 and return on assets which remained in range of 6% to 7% during 2010 to 2013 came down to -2.24%. Profit margin of Tesco Plc remained higher for 2010, 2011, 2012 (5.10%, 5.7%%, 6.46%) then it declined to 3.30% in 2013 and improved slightly to 3.81% in 2014. During same period, returns on asset remained consistent than other two firms and it’s higher than other two firms in 2013 and 2014. On an average J Sainsbury is maintaining operating margin around 5%.
Individual performance:
Best performing: J Sainsbury, Worst performing: WM Morrison Supermarket Plc
Overall:
Best performing: J Sainsbury, Worst performing: WM Morrison Supermarket Plc
Return in Equity
Figure 10: Return on equity analysis
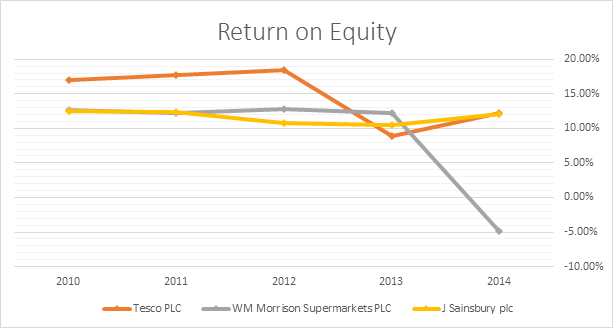
Return on equity has similar trend of Return on assets. Similar to return on assets, return on equity of WM Morrison has trend reversal in 2014. Except, 2014, return on equity of WM Morrison was between 12% to 13% between 2010 and 2013 which declined to -5% in 2014. Though return on equity of Tesco Plc has been higher every year except 2013, volatility of returns makes J Sainsbury more promising and better choice for investment. Also, return of equity of J Sainsbury is consistently higher than 10% and witnessed improvement in 2014 (12.09% vs 10.42%) compared to 2013.
Individual performance:
Best performing: J Sainsbury, Worst performing: WM Morrison Supermarket Plc
Overall:
Best performing: J Sainsbury, Worst performing: WM Morrison Supermarket Plc
Non-Financial KPI
Table 1: Average Full Time Employee
|
Average Full Time Employees |
2010 |
2011 |
2012 |
2013 |
2014 |
|||||
|
Tesco PLC |
366,143 |
382,049 |
401,791 |
388,375 |
391,868 |
|||||
|
WM Morrison Supermarkets PLC |
90,264 |
91,760 |
94,114 |
95,181 |
94,724 |
|||||
|
J Sainsbury plc |
49,400 |
49,100 |
48,800 |
48,100 |
47,300 |
|||||
|
Average Full Time Employees |
2011 |
2012 |
2013 |
2014 |
|
|||||
|
Tesco PLC |
4.3% |
5.2% |
-3.3% |
0.9% |
|
|||||
|
WM Morrison Supermarkets PLC |
1.7% |
2.6% |
1.1% |
-0.5% |
|
|||||
|
J Sainsbury plc |
-0.6% |
-0.6% |
-1.4% |
-1.7% |
|
|||||
Figure 11: Employee base analysis
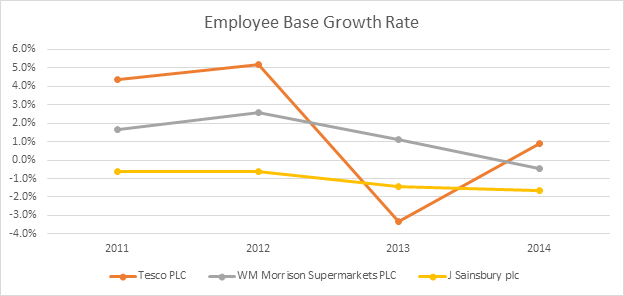
Employee base of J Sainsbury is lowest and even reduces over the years which shows the firm is able to achieve higher revenue though numbers of average full time employees decreased (GÂDOIU, 2014). While Tesco plc has highest number of employees has also lowest revenue per employee and year on year employee base improved except 2013. WM Morrison has employee base round 90,000 to 94,000 between 2010 to 2014.
Table 2: Total sales area (000s square feet)
|
Total Sales Area (000s sqft.) |
2010 |
2011 |
2012 |
2013 |
2014 |
|
Tesco PLC |
95,231 |
103,172 |
110,563 |
106,040 |
109,572 |
|
WM Morrison Supermarkets PLC |
14,233 |
13,421 |
12,904 |
12,261 |
11,867 |
|
J Sainsbury plc |
17,742 |
19,108 |
20,347 |
21,265 |
22,160 |
|
Total Sales Area (000s sqft) |
2011 |
2012 |
2013 |
2014 |
|
Tesco PLC |
8.3% |
7.2% |
-4.1% |
3.3% |
|
WM Morrison Supermarkets PLC |
-5.7% |
-3.9% |
-5.0% |
-3.2% |
|
J Sainsbury plc |
7.7% |
6.5% |
4.5% |
4.2% |
Figure 12: Sales area growth analysis
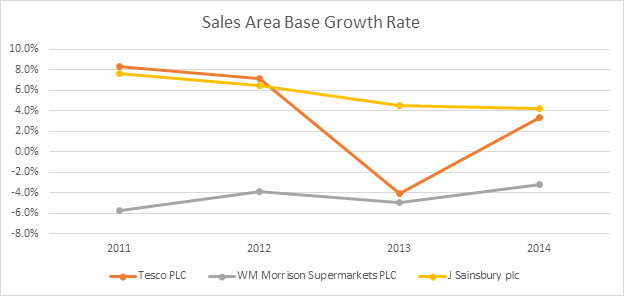
Tesco plc has highest sales area followed by J Sainsbury and WM Morrison. It’s noticeable that WM Morrison has negative growth rate in sales area while J Sainsbury improved sales area year on year which is positive indicator. While Tesco had already six times more sales are than other two players also increased sales are year on year significantly during 2010 to 2014. It seems Tesco is not effective in generating sales are into more productive use looking at financial KPIs while J Sainsbury is outperforming other two players.
Part B
WM Morrison is worst performing companies amongst three. The major areas of improvement are current ratio, quick ratio, asset turnover, inventory turnover, operating margin, returns on assets and return on equity. The liquidity ratios of WM Morrison are quite lower than other two firms and especially quick ratio is significantly lower on absolute term and relative term as well. So first area of improvement is to improve the quick ratio which will automatically improve the current ratio as well.
Second area of improvement is operating margin. Though the company maintained gross ratio higher than 6% in during 2010 to 2014, higher than J Sainsbury Plc throughout, suffered on operating margin in 2014. It directly indicates that the firm needs to cut down operation expenses in order to improve operating margin. Improvement in operating margins will help to improve returns on equity and returns on asset as well.
Finally, the company needs to work on efficiency as well. Asset turnover ratio and inventory turnover ratio is declining year on year for last five years and it’s the only area where firm is competitive to other firms. As it’s a core strength of the firm and turnover ratios are declining other areas are being affected such as revenue growth and net income.
Non-financial measures:
Total sales area of WM Morrison Plc is quite lower than J Sainsbury and Tesco Plc and it decreased by 16.6% in last five years. It’s recommendable to increase the total number of stores and market area in order to boost the revenue and sales. Also average employee per sales are square feet is much higher than other two players. Average employees per thousand square feet of WM Morrison is 8 against the average 2.1 and 3.6 employees per thousand square feet of Tesco Plc and J Sainsbury respectively. So, the company must reduce the employee base and improve the coverage area per employee to be competitive with its industry peers.
So, here are major recommendations which are required to turnout the situation of WM Morrison ("WM Morrison Supermarkets PLC, MRW:LSE financials - FT.com", 2016).
- Financial KPI
- Improve liquidity (quick ratio)
- Control operational expense (to improve profitability)
- Increase turnover ratios (to improve efficiency and sales)
- Non-financial KPI
- Increase total sales area
- Improve average sales area per employee (to bring down operational cost)
Part C
Though financial ratios help to understand financial position of the company and to take investing decision but there are some drawbacks associated with it. Followings are limitations of financial ratio analysis.
- As financial ratios deal with only numbers, it doesn’t address important aspect of business such as product quality, customer satisfaction, employees’ moral, brand image and relation with stack holders which may ultimately can drive the business.
- Financial ratio deals with historical performance of the business. As past performance doesn’t guarantee about future performance it only provides basis for assumption to make future forecasts.
- Financial ratios are useful only when comparing the similar companies in same industry of similar size. Comparing two companies of different industry will be irrelevant for ratio analysis.
- Many companies temper with performance intentionally to make ratio attractive for shareholders and other investors. For example, many business delay payments to creditors in order to show higher cash in the system which increase the account payable.
Answer 2
This report includes four sections which analyze the investment decision of the three-year contract proposal. First section discusses about impact on income statement and cash flow statement and net present value of undertaking the project. The second section includes tax approach, the third section includes investment appraisal method and the last section discuss about factors need to consider before final investing decision.
Financial feasibility
The report prepared by production director missed some important consideration while calculating income tax implications. As the machine will qualify for a 25% writing-down allowance on the reducing balance, pre-tax profit will reduce by only allowable capital allowance not depreciation. As capital allowance is lower than depreciation amount, tax liability is much higher than projected by production director. Below table shows after tax profit for next three years and total profit of three years would be $50,083 and hence return on capital investment would be 33.4%, much lower than expected return of 40.2%.
Table 3: Income statement of JBZ
|
Year 1 |
Year 2 |
Year 3 |
Total |
|
|
|
(£) |
(£) |
(£) |
(£) |
|
Turnover |
£ 180,000 |
£ 180,000 |
£ 180,000 |
£ 540,000 |
|
Materials |
£ 60,000 |
£ 63,000 |
£ 66,150 |
£ 189,150 |
|
Labour |
£ 40,000 |
£ 42,000 |
£ 44,100 |
£ 126,100 |
|
Depreciation |
£ 50,000 |
£ 50,000 |
£ 50,000 |
£ 150,000 |
|
Pre-tax profit |
£ 30,000 |
£ 25,000 |
£ 19,750 |
£ 74,750 |
|
Corporation tax at 33% |
£ 14,025 |
£ 15,469 |
-£ 4,826 |
£ 24,668 |
|
After-tax profit |
£ 15,975 |
£ 9,531 |
£ 24,576 |
£ 50,083 |
As tax liability is delayed by one year, applicable tax of third year would be paid in fourth year. As capital allowance can be claimed as balancing allowances in third year, taxable income turns negative ("Examples of Capital Allowance Tax Calculations - Brookson Ltd", 2016). So, the company can adjust the loss against the profit in coming years. We would include the possible gain from loss in third year tax liability in fourth year. As shown in below table cash flow is positive for all four years and it seems company is able to recover investment of £150,000 in three years itself. But considering 18% cost of capital, present value of future cash flow is £147,114 which is lower than investment of £150,000. Hence, net present value of the proposal is -£2,886. It means project is financially not feasible for investment.
Table 4: Cash flow statement of JBZ
|
Year 1 |
Year 2 |
Year 3 |
Year 4 |
|
|
|
(£) |
(£) |
(£) |
(£) |
|
Pre-tax profit |
£ 30,000 |
£ 25,000 |
£ 19,750 |
|
|
Less: Corporation tax |
£ 14,025 |
£ 15,469 |
-£ 4,826 |
|
|
Add: Depreciation |
£ 50,000 |
£ 50,000 |
£ 50,000 |
|
|
Cash flow |
£ 80,000 |
£ 60,975 |
£ 54,281 |
£ 4,826 |
|
Discount factor 18% |
0.847 |
0.72 |
0.61 |
0.52 |
|
Discounted cash flow |
£ 67,797 |
£ 43,791 |
£ 33,037 |
£ 2,489 |
|
PV of Cash flow |
£ 147,114 |
|||
|
Investment |
£ 150,000 |
|||
|
NPV |
-£ 2,886 |
Taxation Approach
Though depreciation is charged on straight line method for three years, capital allowances is 25% on reducing balance ("Claim capital allowances - GOV.UK", 2016). Table 5 shows capital allowance for next three years and Table 6 shows profits chargeable to corporation tax and tax liability in each of the year. Table 6 clearly shows tax liability is much higher than projected which in fact affects profitability and cash flow of the system significantly. Writing down of balance allowance in third year turns profits chartable to corporation tax into negative and it indirectly saves future tax liability worth of £4,826.
Table 5: Capital allowances computation
|
Year 1 (£) |
Year 2 (£) |
Year 3 (£) |
|
|
Balance bought forward |
£ 150,000 |
£ 112,500 |
£ 84,375 |
|
Allowance @25% |
£ 37,500 |
£ 28,125 |
£ - |
|
Balance allowance |
£ 112,500 |
£ 84,375 |
£ 84,375 |
|
Tax computation |
Year 1 (£) |
Year 2 (£) |
Year 3 (£) |
|
Taxable profits |
£ 30,000 |
£ 25,000 |
£ 19,750 |
|
Add: Depreciation |
£ 50,000 |
£ 50,000 |
£ 50,000 |
|
Less: Capital allowances |
£ 37,500 |
£ 28,125 |
£ 84,375 |
|
Profits chargeable to corporation tax |
£ 42,500 |
£ 46,875 |
-£ 14,625 |
|
Corporation tax @ 33% |
£ 14,025 |
£ 15,469 |
-£ 4,826 |
Alternate investment appraisal method
Two other appraisal method is internal rate of return and payback period. Internal rate of return gives year on year return generated over the life of the project. Here, internal rate of return of the proposal is 16.73% and cost of the capital of the project is 18%. That means the project earns lower return than cost of capital. Hence, the proposal would be rejected.
Payback period shows time period require to recover the capital invested in the project. Appendix 1 shows the calculation of payback period and the payback period of a project is 2.17 years. That means the company would recover initial capital investment in 2.17 years when project life is estimated at 3 years. Usually, companies prefer project with lower payback period in order to reduce investment risk and to recover capital as soon as possible.
Other Factors
- The company must look at the possible range of NPV rather than focusing on single NPV based on the single assumption. Sensitivity analysis is required to get the range of NPV.
- Second, comparing two projects of different size and different time period requires different treatment. Project of large size may not fetch higher IRR than small projects but can generate substantial wealth which is not possible with small scale projects. Also, EAV method should be use when comparing cash flow of different project life.
- Finally, impact on other business on going activities should be considered.
References
Claim capital allowances - GOV.UK. (2016). Gov.uk. Retrieved 9 April 2016, from https://www.gov.uk/capital-allowances/overview
Examples of Capital Allowance Tax Calculations - Brookson Ltd. (2016). Brookson.co.uk. Retrieved 10 April 2016, from http://www.brookson.co.uk/knowledge-centre/limited-company/company-tax/corporation-tax/capital-allowances/example-calculations/
GÂDOIU, M. (2014). ADVANTAGES AND LIMITATIONS OF THE FINANCIAL RATIOS USED IN THE FINANCIAL DIAGNOSIS OF THE ENTERPRISE. Faculty of Economics, University of Piteşti. Retrieved from http://economic.upit.ro/repec/pdf/2014_2_9.pdf
WM Morrison Supermarkets PLC, MRW:LSE financials - FT.com. (2016). Markets.ft.com. Retrieved 9 April 2016, from http://markets.ft.com/research/Markets/Tearsheets/Financials?s=MRW:LSE&subview=IncomeStatement
Appendices
Appendix 1: Payback period
|
|
Year 0 |
Year 1 |
Year 2 |
Year 3 |
Year 4 |
|
Cash flow |
-£ 150,000 |
£ 80,000 |
£ 60,975 |
£ 54,281 |
£ 4,826 |
|
Cumulative cash flow |
-£ 150,000 |
-£ 70,000 |
-£ 9,025 |
£ 45,256 |
£ 50,083 |
|
Payback period |
2.17 |